What is the Jungle Scout Product Database Tool?
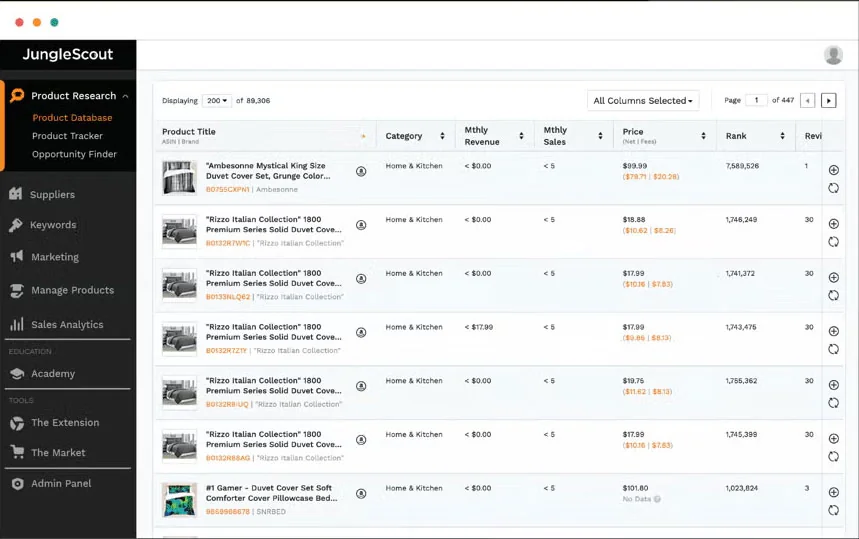
The Product Database is the engine of Jungle Scout. Think of it as a searchable catalog of 500M+ Amazon listings you can slice and dice to surface ideas with real demand and fixable competition—then push straight into deeper validation.
Feature Overview
-
Multi-market search: Flip between the US, CA, MX, UK, DE, etc., to spot openings others miss.
-
Granular filters that matter:
-
Category and price bands to match your brand and margin targets
-
Demand proxies: monthly revenue / units, BSR
-
Competition checks: max reviews, min rating
-
Listing quality: LQS to flag weak content you can beat
-
Logistics sanity: weight, size, fulfillment (Amazon/FBA/FBM)
-
Keyword includes/excludes to hone in on niches (or avoid branded landmines)
-
-
Presets & calculator: One-click presets (e.g., High Demand / Low Competition) and a built-in profit calculator so you don’t chase ideas that won’t pay.
-
Tight integration: Send winners to Product Tracker for monitoring or export a CSV for deeper number-crunching.
Conclusion
The Product Database is where you generate smart shortlists. Use filters to reveal demand you can serve and listings you can out-optimize, then let Tracker and keyword data decide what’s truly worth launching.
Who is the Product Database For And How Does It Help?
It’s useful for both first-time sellers and established brands because it replaces guesswork with filters, real demand signals, and an easy hand-off to the rest of your toolkit.
New Amazon sellers
-
Find ideas that can actually sell: Filter millions of listings to surface high-demand, low-competition products instead of chasing hunches.
-
De-risk your first order: Use sales/revenue and review thresholds to avoid sinking cash into duds.
-
Move fast with clarity: A clean interface turns sprawling Amazon data into a shortlist you can act on.
-
Plug into the next steps: Send winners to Product Tracker for validation and the Supplier Database to source manufacturers.
Experienced sellers & brands
-
Spot new niches early: Pair the database with Opportunity Finder to catch emerging trends before they’re crowded.
-
See the competitive field: Scan sales, pricing, review moats, and LQS to understand where you can out-execute.
-
Scale with data, not hunches: Use market intel to expand the catalog, defend share, and adapt to shifts.
-
Sharpen campaigns: Feed findings into keyword strategy and creative tests for measurable lifts.
Wholesale & arbitrage sellers
-
Buy smarter: Lean on sales velocity, pricing history, and competition signals to pick winners and protect margins.
-
Stay competitive: Track trends that impact Buy Box share and reorder timing.
Conclusion
The Product Database is a smart starting point for anyone serious about Amazon. It finds opportunities you can rank for and profit from, then ties neatly into tracking, sourcing, and optimization so you can move from idea to inventory with confidence.
Jungle Scout Product Database Quick Start Guide
1) Sign up & log in
You’ll need an active Jungle Scout plan. Log into the web app (the Product Database lives there—not in the Chrome Extension).
2) Pick your market & categories
-
Marketplace: Choose where you want to sell (US, UK, CA, etc.).
-
Categories: Start with 2–3 you understand. For private label, I usually exclude tricky spaces (e.g., food, highly regulated, brand-heavy niches).
3) Apply high-signal filters
This is where the magic happens—turn millions of listings into a shortlist.
-
Price: I like $20–$70 to balance margin and conversion.
-
Demand: Set Monthly Revenue (e.g., $6k+) and/or Units to ensure real velocity. (Presets like High Demand are a good jumpstart.)
-
Competition: Cap Reviews (e.g., ≤1,000; tighter if you’re new).
-
LQS (Listing Quality Score): Target low LQS (2–3) with good sales—these are content gaps you can beat.
-
Seller Type: For private label recon, focus on FBA to see peers.
-
Keywords: Use Exclude to remove repeat distractions (e.g., “screws,” “refills”).
-
Logistics (optional): Filter by weight/size to keep fulfillment simple.
4) Review Results
-
Scan metrics: Revenue, units, reviews, rating, LQS.
-
Click through: Open interesting results; sanity-check the niche on Amazon (is revenue concentrated in 1–2 ASINs? Are there obvious brand moats or patents?).
-
Spot opportunities: High demand + low reviews or low LQS usually means you can win with better product + listing.
5) Deepen research with the right tools
-
Product Tracker: Add contenders and watch sales/BSR for 7–14 days to confirm it’s not seasonal noise.
-
Keyword Scout: Build your keyword universe (prioritize relevance + volume).
-
Supplier Database: Find and vet manufacturers once the numbers hold up.
Quick Start Filters
-
Price: $25–$60
-
Monthly Revenue: ≥ $8,000
-
Reviews: ≤ 500 (tighter if you’re brand new)
-
Rating: ≤ 4.3 (room to improve)
-
LQS: ≤ 3–4
-
Seller Type: FBA
-
Exclude Keywords: anything not in your wheelhouse
Tips
-
Don’t chase revenue alone. Check review moats and whether 1–2 listings hoard sales.
-
Think margins early. Use the built-in FBA Profit Calculator with realistic landed costs + PPC + returns.
-
Validate before you buy. Tracker trends > single snapshots every time.
Conclusion
The Product Database is your fastest path from “what should I sell?” to a data-backed shortlist. Use focused filters to reveal demand you can serve—and listings you can out-optimize—then validate with Tracker, keywords, and sourcing before you commit.
What Filters Should You Use to Find a Good Product?
Monthly Estimated Sales: ≥ 300 units (≈10/day) to ensure real velocity.
Monthly Revenue: ≥ $5k–$6k as a sanity check that the niche can support margins.
Competition (find gaps you can beat)
Maximum Reviews: start at ≤ 1,000, then manually verify page-one has several listings ≤ 500 (bonus if some are ≤ 50).
LQS (Listing Quality Score): look for ≤ 6 with decent sales—signals you can out-optimize with better titles, bullets, and images.
(BSR read, not filter): higher BSR within the category usually means softer competition; avoid ultra-dominant #1-#50 markets unless you’re bringing a serious edge.
Profitability & Logistics (protect your margin)
Price: $20–$70 (impulse-friendly but margin-capable after fees/PPC).
Weight: ≤ 5 lb to keep FBA fees and shipping pain down.
FBA Profit Calculator: after filtering, plug in realistic landed costs and PPC to confirm target margins.
Strategic & Exclusion Refinements (save time)
Product Tier: Standard or Small Oversize for simpler storage/fees.
Exclude Keywords: remove recurring junk (e.g., “screws,” “refills”) so results stay relevant.
Categories: favor broad, non-restricted areas (Home & Kitchen, Pet Supplies, Sports & Outdoors); avoid restricted/high-risk niches (electronics, gated categories) if you’re new.
Date First Available: add a recent window (e.g., last 6–12 months) to surface emerging niches.
“New Seller” Preset
Price: $25–$60
Monthly Revenue: ≥ $8,000
Monthly Sales: ≥ 300
Reviews: ≤ 500 (tighten to ≤ 300 if you’re cautious)
Rating: ≤ 4.3 (room to improve quality)
LQS: ≤ 3–4 (content gap)
Seller Type: FBA
Weight: ≤ 3 lb
Exclude Keywords: anything outside your lane (brand names, consumables you don’t want, parts/fasteners)
What To Do After You Get Results
Scan concentration: If the top 3 listings hoard most revenue, proceed carefully.
Spot easy wins: High demand + low LQS or low reviews = upgradeable market.
Run the math: Use the Profit Calculator with real cost quotes (not guesses).
Validate trends: Add contenders to Product Tracker and watch sales/BSR 7–14 days to avoid seasonal head fakes.
Plan differentiation: Better materials, bundle, sizing, warranty, or packaging—win on offer, not just copy.
Common Pitfalls
Chasing revenue only: Pair demand with review moat and LQS or you’ll fight entrenched leaders.
Ignoring fees: Always model FBA, shipping, returns, and starter PPC.
Skipping validation: One snapshot lies—track before you buy.
Conclusion
Use filters to surface buyable demand with fixable competition, confirm margins with the calculator, then validate momentum in Product Tracker. That workflow turns the Database from a catalog into a pipeline of launch-ready ideas.
Product Database Advanced Tips
Advanced Filtering That Surfaces Winnable Niches
1) “Sells well despite a bad listing”
Monthly revenue: ≥ $5k–$10k
Max reviews: <1,000
Max rating: ≤ 3.5–4.0
Max LQS: ≤ 3–4
Why: Strong demand + weak content = a listing you can out-execute (images, title, bullets, A+).
2) New-but-rising products (early trend sniffing)
Listing age: ≤ 3–6 months
Monthly sales: ≥ 50–100
Reviews: <50
Why: Signals emerging demand before the review moat forms.
3) Bundle plays
Include keywords: “set,” “kit,” “bundle”
Check components: If a “gardening set” wins, verify each tool has demand.
Why: You can out-bundle with better curation, packaging, or value.
4) Larger pack strategy
Target items bought in multiples (filters, pods, fasteners).
If 50-packs are moving, test a 100-pack value tier.
Why: Lift AOV and defend margin without a race to the bottom.
Pair The Database With Adjacent Tools
Opportunity Finder (keyword-first angle)
From product → run OF to map growth, seasonality, related keywords.
From keyword → return to Database to find actual products tied to high-demand, low-competition terms.
Product Tracker
Add contenders; monitor sales, price, BSR for 30 days.
Consistency beats spikes. Walk from seasonal fakes.
Keyword Scout
Build a keyword universe; prioritize high relevance + solid volume.
Reverse-ASIN top competitors to uncover must-win terms.
AI Assist
Pull pain points and loved features from competitor reviews.
Turn insights into product specs, image infographics, bullets, and FAQs.
Here’s how I’d use Jungle Scout to uncover bundle opportunities that actually move the needle—practical, opinionated, and built for margin.
Finding Bundled Product Opportunities
Bundles let you differentiate fast, raise AOV, and avoid head-to-head price wars. The Product Database helps you spot where a “better together” offer beats single-item listings.
1) Find existing bundles you can outclass
Filters:
Include Keywords: “kit”, “set”, “bundle” (plus your niche term)
Monthly Revenue: ≥ $5k–$10k
Reviews (max): ≤ 1,000 (tighter if you’re cautious)
Optional: LQS ≤ 3–4 to flag weak content
What to look for: bundles with demand but thin reviews, missing pieces, or poor photos.
Example: Search “golf accessories kit.” If most sets skip alignment sticks or ball marker tools, build the complete starter set and win on value + clarity.
2) Mine reviews to build complementary bundles
Workflow:
Use the Database to find a high-demand single item (e.g., wide-mouth water bottle).
Run AI Review Analysis on that ASIN.
Pull recurring asks: strap, cleaning brush, straw lid, etc.
Bundle those add-ons into a “complete solution” and highlight them in images.
Why it works: you’re solving real customer complaints, not guessing.
3) Upgrade underperforming bundles
Filters:
Rating (max): ≤ 3.5–4.0
LQS (max): ≤ 3–4
Monthly Revenue: ≥ $5k (demand exists)
Playbook:
Read reviews → list failure points (cheap components, missing parts).
Source better parts via Supplier Database.
Relaunch with clean hero image, what’s-in-the-box infographic, and a benefit-led title/bullets.
4) Piggyback on Amazon’s cross-sell signals
Search a general product (e.g., yoga mat) in the Database.
On Amazon, scan Frequently Bought Together / Also Viewed.
Build a mat + block + strap bundle (or add a towel/roller for a premium tier).
Validate in Keyword Scout (terms like “starter kit,” “beginner set,” “gift set”).
Validation & optimization (don’t skip these)
Track before you buy: Add candidates to Product Tracker for 2–4 weeks. You’re looking for consistent sales/BSR, not holiday spikes.
Keyword coverage: In Keyword Scout, confirm demand for “[niche] set/kit/bundle” and ensure your title/bullets map to those phrases.
Price architecture: Aim to price 5–15% below the sum of parts—or add exclusive value (quality, quantity, warranty) to justify higher AOV.
Fees & size tiers: Model the bundle’s final dimensions/weight in the Profit Calculator. One inch can bump you into a pricier FBA tier.
Practical packaging & compliance notes
One physical SKU (not just a “virtual bundle”): single FNSKU, bag/box labeled “This is a set—do not separate.”
QC matters: a single bad component tanks the whole bundle’s reviews.
Avoid gated/hazmat combos; keep components in the same category when possible.
Differentiate visibly: show the added items clearly in image #2 with callouts/dimensions.
Quick starter queries (copy/paste)
Include keywords: “kit”, “set”, “bundle”, “starter”, “gift”
Exclude keywords: parts you don’t want (e.g., “refill,” “screws”)
Filters: Revenue ≥ $8k, Reviews ≤ 500, Rating ≤ 4.2, LQS ≤ 3–4
Additional Tips
Stack signals, don’t isolate them: Revenue + low LQS + weak rating is a green light; any two without the third → dig deeper.
Watch revenue concentration: If top 2 ASINs hoard the pie, you’ll need a true USP (not just better copy).
Model margins early: Use the Profit Calculator with real landed costs + PPC + returns.
Validate before PO: Tracker trends > screenshots—always.
Conclusion
Advanced sellers win by triangulating—use the Database to find anomalies, then confirm with Opportunity Finder, Product Tracker, Keyword Scout, and AI-driven review insights. That combo turns “interesting” into investable.
What’s the Difference Between Product Database and Other Jungle Scout Tools?
Product Database = idea generator. It’s the front door: a fast, product-first scan to surface high-demand, low-competition ideas. Everything else either validates those ideas or helps you execute.
Product Tracker vs. Product Database
Product Database: Snapshot. Filter millions of listings by price, revenue, reviews, LQS, etc., to build a shortlist.
Product Tracker: Timeline. Monitor shortlisted ASINs daily (sales, price, inventory, BSR) to confirm consistency and seasonality before you buy.
Opportunity Finder vs. Product Database
Product Database: Product-first. Great for meeting hard financial criteria fast.
Opportunity Finder: Keyword/niche-first. Finds high-demand, low-competition search terms, trend curves, and seasonal windows—often surfaces niches you won’t spot from products alone.
Keyword Scout vs. Product Database
Product Database: What to sell. Identifies listings with promising numbers.
Keyword Scout: How to win the shelf. Builds the keyword universe (relevance, volume, competitiveness) for your listing and PPC once a product looks viable.
Supplier Database vs. Product Database
Product Database: Discovery. Validates market potential.
Supplier Database: Sourcing. Uses U.S. import records to find real manufacturers (including your competitors’), so you can quote, vet, and negotiate.
The workflow I recommend
Product Database: Apply high-signal filters (price, revenue, reviews, LQS) to generate a shortlist.
Product Tracker (1–4 weeks): Validate steady demand and weed out seasonal spikes.
Keyword Scout: Map must-win keywords (seed + reverse ASIN) for listing and PPC strategy.
Supplier Database: Identify proven factories, request quotes, and align specs to the review insights you found.
Tips
Stack signals: Demand + low LQS or low reviews beats any single metric.
Watch revenue concentration: If 1–2 ASINs hoard sales, you’ll need a real USP—not just better copy.
Model margins early: Use the Profit Calculator with real landed costs and starter PPC; don’t fall in love with topline revenue.
Conclusion
Think of Product Database as your radar. Tracker, Opportunity Finder, Keyword Scout, and Supplier Database are the instruments that confirm the target and guide you to launch.
Active Jungle Scout Discounts and Coupons
Our updated list of Jungle Scout deals and promo codes now offers up to 56% off. No need to copy and paste the Jungle Scout coupon code — just click my link for a discount code and it will automatically apply. Plus, you can try Jungle Scout risk-free thanks to its 7-day money-back guarantee.

UP TO 56% OFF
Use Jungle Scout discount coupon: PROJECTFBA and Get up to 56% OFF
Jungle Scout Product Database FAQ
Jungle Scout’s Product Database (now a core piece of Catalyst in 2025) is your high-powered search engine for Amazon’s catalog. You plug in smart filters—category, sales/revenue/BSR, reviews, weight/size, and even competition via LQS—and it surfaces products that actually fit your profit and risk profile across multiple marketplaces.
Preset recipes like High Demand, Low Competition, or Bad Marketing speed things up, while the built-in FBA Profit Calculator keeps margins honest.
Promising finds push straight to Product Tracker for validation (or export to CSV) so you’re making data-driven calls, not guesses. In my view, it’s the fastest way to go from “what should I sell?” to a defensible, numbers-backed shortlist.
Jungle Scout’s Product Database lets you sift through 500M+ Amazon products with precise filters so you find ideas with real demand and manageable competition—no guesswork.
How it works
Open Product Database in your JS dashboard.
Pick a marketplace (e.g., US, UK).
Set filters to match your goals:
Categories: include/exclude (Pet Supplies, Sports & Outdoors, etc.).
Performance: min sales/revenue/BSR to prove demand.
Competition: max reviews or low LQS to spot weak listings.
Financials: use the FBA Profit Calculator to confirm margins.
Attributes: cap weight/size to control FBA fees.
Review results (price, est. sales, reviews), export CSV if needed.
Track winners in Product Tracker to validate over time.
Smart search moves
Presets: Try High Demand, Low Competition, or Bad Marketing for instant, high-signal results (e.g., High Demand ≈ 750+ units/month).
Keywords: Include niche terms; Exclude irrelevant ones to clean results.
Exploit weak listings: Filter for low LQS to find products you can outperform with better images, titles, and copy.
Performance
Monthly Estimated Sales – My quick read on real demand and sales velocity.
Monthly Estimated Revenue – Useful for sizing the pie (but margin still rules).
Best Seller Rank (BSR) – Directional only; compare within the same category.
Sales Trends – I want smooth, consistent curves—spiky charts scream promo or seasonality.
Profit & Costs
Price – I skim current and historical price to spot volatility and race-to-the-bottom risk.
FBA Fees – Itemized fees keep me honest on storage/fulfillment costs.
Net Profit per Sale – I sanity-check with my own COGS and shipping; tool estimates are a starting point.
Competition & Listing Quality
Review Count – Lower reviews = easier entry. I love markets where top sellers are <500 reviews.
Star Rating – Sub-4.0 often signals fixable product issues (hello, differentiation).
Listing Quality Score (LQS) – Low LQS + good sales = “upgrade the listing and win.”
Seller Info & Fulfillment – Amazon retail on the listing is a yellow flag; FBA vs. FBM tells me how pros the field is.
Number of Sellers – Many sellers = buy box battles; I prefer single-seller private label.
Practicalities
Product Tier & Weight – Fees and breakage risk live here; lighter/smaller wins for beginners.
Date First Available – New + strong traction can be trend gold; older + steady is safer.
Category – Stay consistent when comparing BSR and velocity.
ASIN – For tracking, reverse-ASIN research, and supplier sleuthing later.
How I turn metrics into a decision
My short list tends to share four traits: steady demand, clean margins after FBA, weak/under-optimized listings, and manageable review moats. From there, I push promising ASINs to Product Tracker for 2–4 weeks to confirm consistency, then build my keyword plan and source. The database gives me the signal; the follow-through (tracking, keywords, sourcing) turns that signal into a product that actually sells.
Use advanced filters
Categories: Focus on niches you want (e.g., Pet Supplies) and exclude tricky ones (e.g., Electronics, Grocery).
Performance data: Set min monthly revenue/sales and max reviews to surface high-demand, lower-competition products.
Keywords:
Include terms to zero in on a niche (separate with commas:
golf, clubs).Exclude to clean noise (
refill, replacement).Use quotes for exact phrases:
"golf clubs".
Product attributes: Filter price, rating, weight/size to protect margins and shipping costs.
Competition signals: Add a max LQS (Listing Quality Score) to find poorly optimized listings you can beat.
Seller info: Filter by FBA/FBM/Amazon to know who you’ll face.
Date First Available: Spot new, early-momentum products (emerging trends).
Quick example (new seller preset): Price $20–$70, Revenue $6k+, Reviews ≤ 500, LQS ≤ 4, Weight ≤ 5 lb, Exclude “refill,” “bulk,” “bundle.”
Save and reuse what works
Built-in presets: Try High Demand, Low Competition, Bad Marketing for instant, high-signal starting points.
User presets: Save your custom filter set under User Presets so you can rerun refined searches in one click.
Customize your view (so you move faster)
Sort columns: Rank by revenue, reviews, BSR, or LQS to prioritize at a glance.
Show/hide columns: Keep only what matters (price, est. sales, reviews, LQS, weight).
Results per page: Increase to scan faster.
Export to CSV: Pull results into a spreadsheet for deeper modeling or team review.
Tips
Stack filters, then relax one at a time to widen your funnel without inviting junk.
Pair low LQS with proven demand—that’s classic “fix the listing and win” territory.
Push finalists to Product Tracker for 2–4 weeks to confirm consistency before you spend a dollar.
Yes—Product Database comes with every Jungle Scout plan, but the usage limits and depth scale by tier.
Plan access at a glance
- Starter Plan: For new sellers. Limited access (e.g., ~100 Product Database searches/month).
- Growth Accelerator: For growing stores. Unlimited Product Database searches and more historical data.
- Brand Owner + Competitive Intelligence: For larger brands. Unlimited searches plus advanced Competitive Intelligence tooling.
How to choose
- Just starting out? Go Starter to validate ideas without overcommitting.
- Researching often or scaling? Pick Growth Accelerator so you don’t hit search caps.
- Operating at brand scale? Choose Brand Owner + CI for maximum usage and deep competitor analysis.
Tip: Check Jungle Scout’s pricing page for the latest limits and inclusions before you decide.
Starter filters (beginner-friendly)
Pricing & profit
Price: $20–$70 (sweet spot for margin + impulse buys)
Net revenue per sale: $15+ (after fees; sanity-check with the FBA calculator)
Demand signals
Monthly units: 300+ (≈10/day for steady velocity)
Monthly revenue: $5,000–$50,000 (big enough to matter, not dominated by giants)
Competition & quality gaps
Max reviews: ≤100 (aim for niches where several top sellers are under 100)
Star rating: ≤4.0 (room to improve on product quality)
LQS (Listing Quality Score): ≤6 (poorly optimized listings you can outshine)
Logistics (keep it easy)
Weight: ≤5 lb
Product tier: Standard Size (avoid oversize fees)
Number of sellers: ≤3–5 (reduces buy box wars; better for private label)
Clean up the results
Exclude keywords:
bundle, case, refill, replacement(adjust to your niche)Category picks: Start with Home & Kitchen, Pet Supplies, Sports, Office; avoid regulated/complex categories (e.g., Electronics, Clothing, Grocery) at the beginning.
How I use these (fast workflow)
Run the filters → sort by revenue to spot promising markets.
Scan reviews distribution: Make sure multiple top listings have low reviews (not just one outlier).
Check LQS gaps: Low LQS + good sales = “optimize the listing and win.”
Validate margins: Plug real COGS into the FBA Profit Calculator.
Track 2–4 weeks: Push finalists to Product Tracker to confirm consistency (watch for seasonality/promo spikes).
When to widen the net
Not enough results? Relax one variable at a time (e.g., raise max reviews to 200, lower units to 200+, widen price to $18–$80).
Too many results? Tighten reviews (≤50), drop star rating to ≤3.8, or cap weight at ≤3 lb.
Quick preset to save:
Price $20–$70 · Net Rev $15+ · Units 300+ · Rev $5k–$50k · Reviews ≤100 · Stars ≤4.0 · LQS ≤6 · Weight ≤5 lb · Standard Size · Sellers ≤5 · Exclude: bundle, case, refill, replacement · Categories: Home/Kitchen, Pet, Sports, Office
Use this as your baseline, then tweak to fit your budget, supplier quotes, and risk tolerance.
Jungle Scout’s Product Database doesn’t show Amazon’s exact sales, because Amazon doesn’t share that data publicly. Instead, Jungle Scout estimates sales using its proprietary AccuSales™ algorithm. In practice, these estimates are widely considered reliable and among the most accurate available, but they’re best used as a guide, not a precise count.
How AccuSales™ works
AccuSales™ processes large volumes of data daily to predict sales. Key inputs include:
Best Seller Rank (BSR) – The strongest signal of sales velocity within a category.
Historical performance – How a product’s BSR and sales have trended over time.
Category and marketplace context – Signals from the specific category and Amazon marketplace to refine estimates.
Accuracy and limitations
Great for validation – Many sellers use Jungle Scout to validate ideas and gauge market potential with data-backed confidence.
Not 100% exact – Estimates can differ from true sales, especially during rapid market shifts or seasonality.
Strong on relative accuracy – Even if unit counts have a margin of error, relative comparisons are very useful. If Product A shows roughly 2x the sales of Product B, it likely does sell significantly more.
Continuous improvement – Jungle Scout updates its models over time. In a 2022 assessment, estimates were within 15% of actual sales for 82% of tested listings.
Use context and corroboration – For high-stakes decisions, cross-check with competitor analysis, historical trends, and your own margin math.
Practical tips
Think ranges, not single numbers – Treat estimates as a band of likely outcomes.
Compare like-for-like – Compare products within the same category and marketplace for cleaner signals.
Watch trend lines – Rising or falling BSR and revenue over weeks tells a better story than a single snapshot.
Layer in profitability – Pair demand estimates with fees, costs, and realistic pricing before you green-light a product.
Both tools help you research winning products, but they shine at different moments in your workflow.
Product Database – Web app for casting a wide net. You apply filters to surface broad product ideas across Amazon’s catalog.
Chrome Extension – Browser tool for instant, on-page insights. You run it on Amazon search results or product pages to validate niches in real time.
Jungle Scout Product Database
Primary use case: Generate broad ideas by filtering Amazon’s catalog based on sales, revenue, reviews, and more.
Location: Accessed directly on the Jungle Scout website (not tied to a browser).
Workflow: Top-down approach — start with filters, shortlist ideas, then investigate further.
Data presented: Filtered product lists with key metrics like estimated sales, revenue, and BSR.
Integration: Send product ideas directly to the Product Tracker and other Jungle Scout tools.
Real-time data: Data may need refreshing to stay current.
Best for: Beginners who don’t have a product idea yet, or advanced sellers exploring new markets.
Jungle Scout Chrome Extension
Primary use case: Analyze specific niches and products in real time while browsing Amazon.
Location: Installed as a browser extension for Chrome or Firefox.
Workflow: On-the-fly approach — run it on search results or product pages for quick snapshots.
Data presented: Real-time overlay with sales estimates, historical trends, and other key metrics for the products on the page.
Integration: Add promising listings to the Product Tracker with a single click.
Real-time data: Pulled live from the Amazon page you’re viewing.
Best for: Quickly validating product ideas and assessing competition and demand within a niche.
How they work together
Generate with the Product Database
Use filters to uncover niches that match your demand, competition, and price criteria.Validate with the Chrome Extension
Search the niche on Amazon and run the extension on the results to confirm demand, competition, and listing quality in real time.
Quick tips
Start broad, then zoom in – Use the Database to shortlist, then use the Extension to sanity-check the top listings.
Track what matters – Add candidates to Product Tracker to watch trends over days and weeks.
Compare like-for-like – Validate within the same category and marketplace for cleaner signals.
Yes, both the Growth Accelerator and the Brand Owner + Competitive Intelligence plans include unlimited access to the Jungle Scout Product Database. By contrast, the Starter plan places a cap on usage, allowing only a limited number of searches each month.
Product Database access by plan
- Starter
- Product Database access: 100 searches per month
- Ideal for: New sellers doing basic research to validate a business idea
- Growth Accelerator
- Product Database access: Unlimited searches
- Ideal for: Established sellers who research new opportunities frequently and need to scale
- Brand Owner + Competitive Intelligence
- Product Database access: Unlimited searches
- Ideal for: Large brands and agencies needing maximum usage for deep market and competitor analysis
What this means for sellers
- Unlimited access gives you freedom to run broad and targeted searches without worrying about limits
- Especially valuable for experienced or scaling sellers who explore new products and markets often
- Lets you iterate faster, compare niches side by side, and build a stronger shortlist before tracking in Product Tracker
No. Jungle Scout does not offer a free trial. Instead, all standard plans come with a 7-day money-back guarantee. This lets you subscribe, use the full platform, and request a refund within 7 days if it’s not a fit.
How the 7-day guarantee works
Subscribe to a plan
Choose any standard plan to start using Jungle Scout.Explore the features
You’ll have full access for 7 days, including tools like Product Database and Keyword Scout.Request a refund
If you’re not satisfied, contact Jungle Scout support via chat or email within 7 days to request a refund. Note: refunds are not automatic upon cancellation.Receive your refund
Once processed by Jungle Scout, refunds typically appear in your account within 5-10 business days.
Tips to make the most of the 7 days
Plan your tests in advance so you can hit the ground running.
Validate a few product ideas end to end: demand, competition, and profitability.
Save your work to Product Tracker to monitor trends during the trial window.